

Daily Mission Update / Student Blog Entry
Over the next 6 weeks, scientists from around the country are taking part in a large field project coined: Plains Elevated Convection at Night, or PECAN for short. PECAN, which began on 1 June, is a multi-agency project (NSF, NOAA, NASA, DOE) funded by the National Science Foundation. The campaign is intended to study four meteorological phenomena related nocturnal convection: Mescoscale Convective Systems (MCS), Low-Level Jet (LLJ), Convective Initiation (CI), and Undular Bores. The project includes both mobile and fixed PECAN Integrated Sounding Arrays (PISAs), dozens of in-situ instruments, mobile radars, mobile mesonet vehicles, balloon-launching vehicles and many others. The majority of the equipment and mobile weather instruments are stationed in Hays, KS.
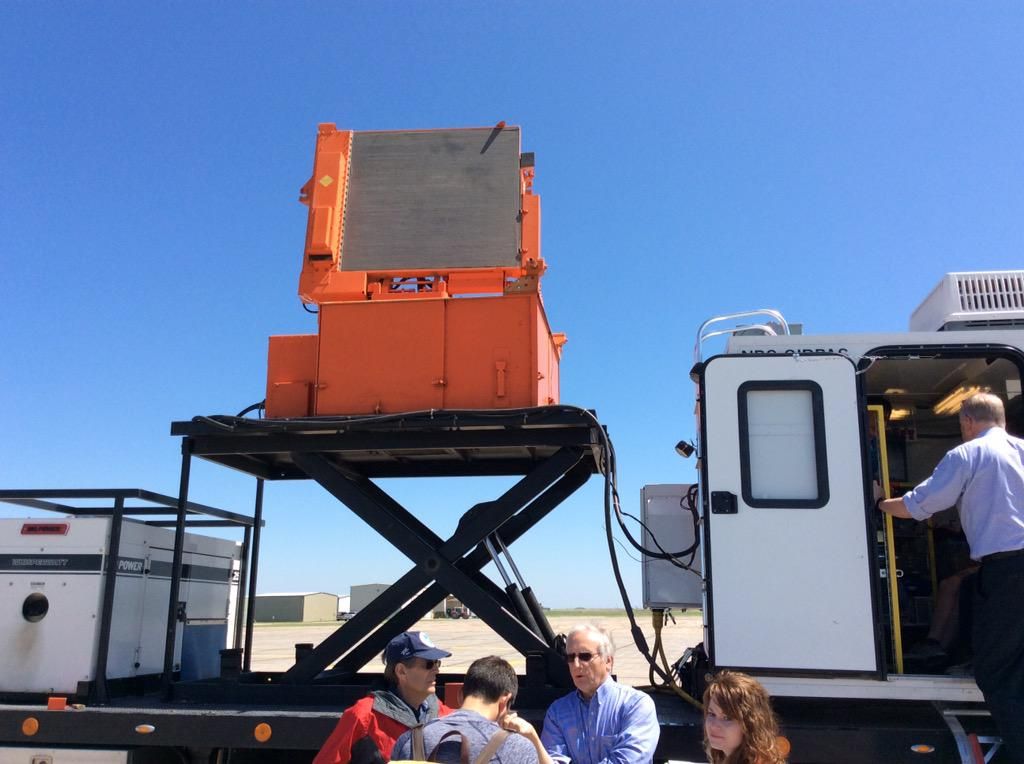
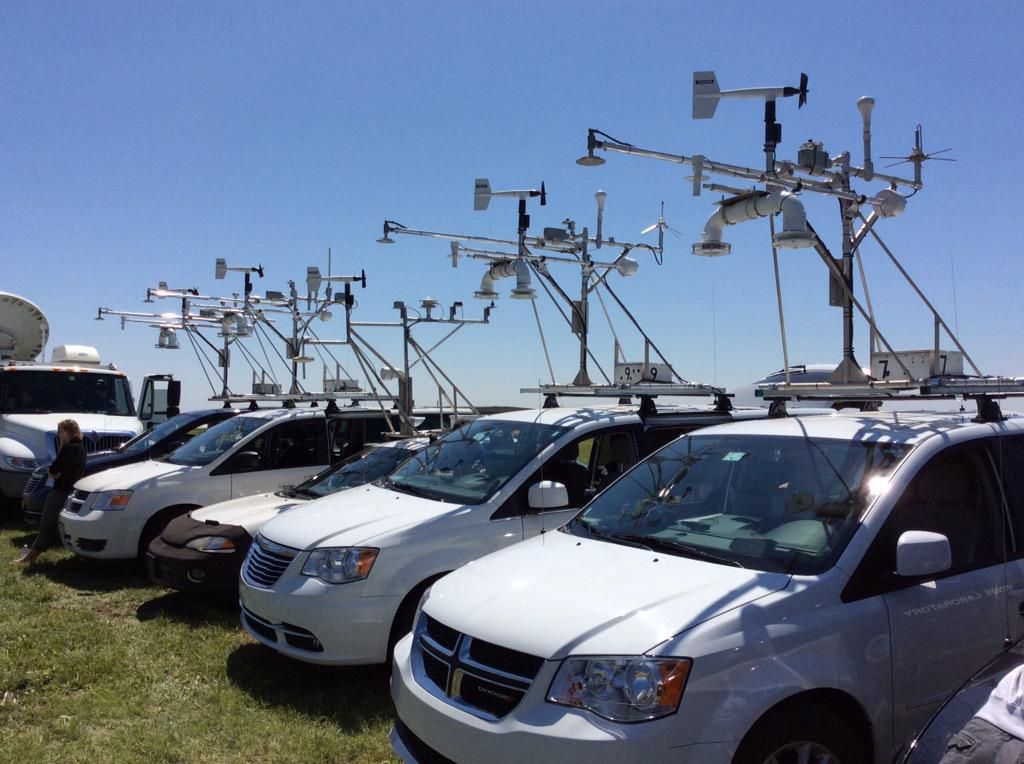
On Saturday, May 30, PECAN sponsored an open house, located at Fort Hays Regional Airport. The majority of the equipment that will be in use over the next 6 weeks was on display for the public to see. The photos below, captured by meteorologists at the National Weather Service in Dodge City (@NWSDodgeCity) show some of the sights through the course of the day.
Since 1 June, there have been four PECAN missions, one of which being a "shakedown" mission to test communications and logistics. The other missions included: LLJ (3 June), MCS (4 June), and Bore (5 June).
For more information on PECAN, please visit: https://www.eol.ucar.edu/content/pecan-nutshell
This week's contributing author to the student blog is Jacob DeFlitch, a student intern with the Center for Severe Weather Research. As the project progresses, students will be providing a detailed summary of each individual mission, and first-hand accounts from the field. Stay tuned!
To download a PDF version of this week's blog entry, please click here.
Report Summary
The PECAN (Plains Elevated Convection at Night) campaign is envisioned as a multi-agency project (NSF, NOAA, NASA, DOE) designed to advance the understanding of continental, nocturnal, warm-season precipitation.
Report by DATE
1 June 2 June 3 June 4 June 5 June
6 June 7 June 8 June 9 June 10 June
11 June 12 June 13 June 14 June
15 June 16 June 17 June 18 June
19 June 20 June 21 June 22 June
23 June 24 June 25 June 26 June
27 June 28 June 29 June 30 June
1 July 2 July 3 July 4 July 5 July